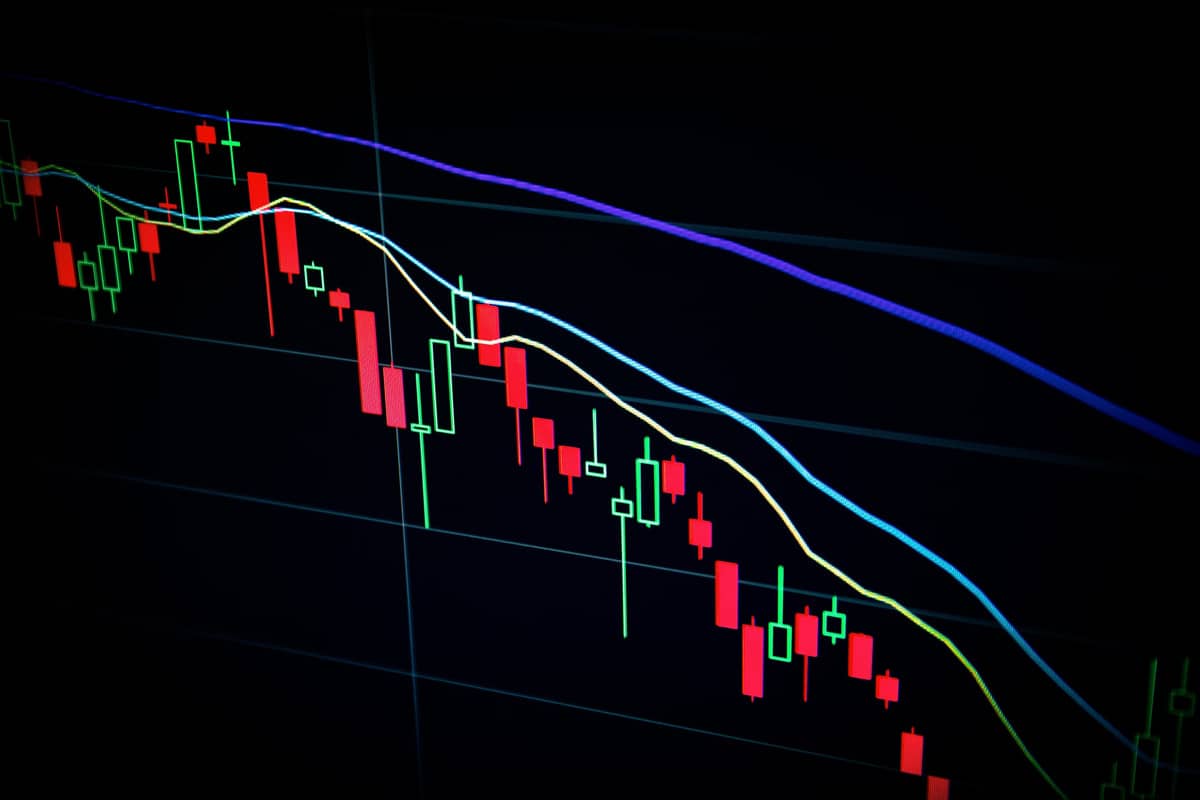
A leading strategist at Bank of America has warned that the U.S. stock market may be heading toward another financial bubble, pointing to key signs that resemble previous historic bubbles.
Michael Hartnett, a well-known market analyst, says the current situation is similar to the early 1970s, just before inflation in the U.S. spiraled out of control.
Hartnett also highlights rising tensions between former President Donald Trump and Federal Reserve Chair Jerome Powell over interest rate policy as a major risk to financial stability.
The Clash Over Interest Rates
Trump has publicly demanded large interest rate cuts, hoping to reduce government debt costs without cutting spending. According to Hartnett, Trump wants the Fed to lower rates by as much as 300 basis points, bringing them down to 1%. However, if this happens, long-term borrowing costs might actually increase, as investors could expect inflation to return.
Currently, U.S. government spending is at a record $7 trillion. Since most of this spending cannot be reduced—such as defense and mandatory programs—Trump’s solution focuses on interest rate cuts to ease the national debt burden.
A “Big Beautiful Bubble”?
Hartnett warns that the fastest way to pay for Trump’s proposed new spending plan, referred to as the “One Big Beautiful Bill,” could be by inflating asset prices. This means creating a market bubble, where stocks rise sharply even without a strong economic reason.
He predicts that Wall Street will begin to act as if the Fed will soon cut interest rates, regardless of whether a recession is coming. Investors may start moving their money into riskier assets like tech stocks, gold, and cryptocurrencies, while selling the U.S. dollar and long-term government bonds.
How to Spot a Bubble: The VIBBE Checklist
Hartnett outlines five classic signs of a stock market bubble, using the acronym VIBBE:
- V for Valuation: Stock prices become very expensive compared to company earnings. The “Magnificent 7” tech stocks are trading at 44 times their earnings—high, but not yet at the 58 times average seen in past bubbles.
- I for Inflation: In previous bubbles, consumer prices also went up. Inflation reached 4% during Japan’s 1980s bubble and the late 1990s tech bubble in the U.S.
- B for Bonds: Bond yields usually rise in a bubble as investors demand higher returns. In the past two years, the yield on 30-year U.S. Treasury bonds has increased by 1.5%.
- B for Breadth: Market gains become concentrated in a small number of large companies. Today, the top 10 stocks in the S&P 500 make up 38% of the index, compared to 27% during the dot-com bubble.
- E for Exponential Price Gains: Bubbles often include sharp stock price increases. The Magnificent 7 tech stocks have gained 187% in two years, still below the average bubble gain of 244%.
What’s Next?
Hartnett believes investors are already positioning for Fed rate cuts and a potential bubble, especially in tech stocks and alternative assets like crypto. He cautions that if inflation rises alongside stock prices, the situation could worsen.
In the end, Hartnett says the biggest warning sign will be if stocks keep climbing despite rising inflation and bond yields. If that happens, it may confirm that the market is in a true financial bubble.


